

The True Cost of Batch Filtration: Downtime, Labor, and Yield Loss
Most plants measure batch filtration downtime the same way they measure the rest of the filter press operation: by cycle time, wash consumption, and the maintenance calendar. Those numbers matter, but they leave out some of the largest costs of running a batch press. Operator hours, unplanned stops, and product lost along the way tend to land in other budgets, where they are easy to overlook.
Earlier posts in this series looked at the batch filtration bottleneck through throughput and wash efficiency. This one looks at the operating costs that build up around a filter press over months and years: the labor needed to supervise and service it, the reliability failures that stop production without warning, and the yield lost to mechanical handling.
Batch bottlenecks, labor-intensive operation, unplanned downtime, and difficulty scaling are the pain points process engineers and plant managers raise most often. The sections below break each one down and offer a practical way to put a number on it before the next capital project review.
The Labor Cost of Supervising and Servicing a Batch Filter Press
Modern filter presses are often automated at their core. Filling, pressing, and in many designs, plate shifting and cake discharge run on a programmed cycle. Automation still leaves steady work for operators. Someone has to supervise each cycle, step in when cake sticks to the cloth or a plate does not release cleanly, inspect cloth condition, and restart the batch. A continuous filtration system is designed to run at a steady process flow with far less routine intervention.
Cloth changes and full press cleaning add a second layer of labor. These are recurring events on a batch press, and depending on the product and the size of the press, a full cleaning and re-clothing cycle can take multiple days.
Hazardous or high-purity materials raise the stakes. Re-clothing and cleaning in those applications can require full enclosure suits, decontamination steps, and significant prep and cooling time before an operator can begin work.
Measuring Filter Press Labor Cost in Operator-Hours
Headcount alone understates filter press labor cost. A more useful measure is operator-hours per cycle and per shift, broken out by task: cycle supervision, discharge assistance, cloth inspection, re-clothing, and cleaning. That breakdown lets a plant compare its current labor requirement directly against what a continuous system would need.
The dollar value adds up quickly. Eliminating the need for one operator per shift can save more than $300,000 per year, based on the annual mean wage for plant operators across round-the-clock shift coverage.
In one documented case, a plant running horizontal automated filter presses still needed a multi-day maintenance window roughly every six to eight weeks for cleaning and changeovers. The core press cycle was automated, but the labor required to keep the presses in service remained substantial.
Unplanned Downtime: The Cost Batch Filtration Hides Until It Fails
Batch press reliability issues such as worn cloths, seal failures, and plate damage tend to surface as unplanned stops. A scheduled maintenance window can be planned around. An unplanned stop hits the production schedule wherever it happens to fall, which makes it far more disruptive.
Some plants respond by installing a second press purely as a backup, so production can continue while the first unit is down. That is capital spent to compensate for a reliability problem, and it adds no net capacity.
A Documented Case: Backup Presses and a Continuous Alternative
The same plant faced exactly this situation. Frequent maintenance and short intervals between failures on its horizontal automated filter presses forced it to install a second press as a backup. After switching to a continuous Rotary Pressure Filter, routine maintenance time dropped to roughly one-tenth of what the presses had required, and machine availability rose above 96 percent.
How Downtime Spreads Beyond the Filter
Batch filtration downtime rarely stays contained to the filtration step. Upstream, crystallization or fermentation campaigns can back up while the filter is offline. Downstream, drying and packaging lines tuned to a steady feed sit idle or run erratically.
For that reason, unplanned downtime deserves its own tracked number. When evaluating batch filtration bottleneck symptoms, log unplanned downtime hours separately from planned maintenance, and include the cost of any redundant capacity added to cover for it.
Yield Loss in Batch Filter Press Operation
Yield loss is the least visible of the three costs, partly because it tends to appear as a percentage in a quality report instead of a line item. High pressing pressures in a batch filter press can fracture or damage delicate crystals and particles. That increases fines and reduces the amount of usable product each batch delivers.
Cake quality also varies plate-to-plate and even within a single plate. That variability is a quality risk and a yield risk at the same time, since off-spec cake may need to be reworked or discarded.
Cleaning and re-clothing cycles carry their own product loss as well, from residual material left in press chambers to material handled outside the closed process during changeover.
In the documented case, high pressing pressure was fracturing delicate L-threonine crystals and increasing fines. Continuous thin-cake filtration applied gentler conditions, avoided that mechanical damage, and still met the plant’s purity target of above 98.5 percent along with its moisture targets.
To give yield loss its proper weight in a capital project review, convert it to lost product value per batch or per year. A yield loss of a few percent can sound minor on a quality report. Expressed as annual product value, the same figure often becomes one of the largest numbers in the comparison.
Why These Costs Rarely Show Up in a Capital Equipment Comparison
A standard batch-vs-continuous capital comparison usually weighs purchase price, footprint, and rated throughput. Labor, unplanned downtime, and yield loss sit in different budgets, typically maintenance, production, and quality, and seldom get summed into one number.
That split is why a batch filtration bottleneck rarely looks like one dramatic failure. It looks like operator hours, redundant equipment, and lost yield accumulating quietly across departments until someone pulls the numbers together.
This cost picture is one input into the larger batch to continuous filtration decision, alongside throughput, wash efficiency, and footprint. A defensible total-cost picture can start with three inputs:
- Operator-hours per batch, including cycle supervision, discharge assistance, cloth changes, and cleaning
- Unplanned downtime hours over the last 12 months, plus the cost of any backup equipment installed to cover for them
- Estimated product loss from cake variability, fines, and handling during changeovers
Questions to Ask Before You Accept Your Current Batch Filtration Costs as Fixed
- How many operator-hours per shift are tied up in cycle supervision, discharge, cloth inspection, re-clothing, and cleaning on the current batch press?
- How much unplanned downtime has the filtration step logged in the last 12 months, and is any installed capacity redundant equipment added specifically to cover for it?
- What percentage of product is lost to fines, off-spec cake, or handling losses during batch cycles and changeovers, and has that been converted into a dollar figure?
- If labor, downtime, and yield loss were added to the equipment’s purchase price, how would the total cost of the current batch system compare to a continuous alternative?
- Has the actual process slurry been tested on a continuous platform, or is the batch-to-continuous comparison still theoretical?
How BHS-Sonthofen Inc. Approaches This
BHS approaches this as a measurement problem first. The work starts with quantifying labor, downtime, and yield exposure using real process data and only then turns to whether a continuous technology improves on the current batch press.
Bench-Scale and Pilot Testing at BHS’s Charlotte Lab
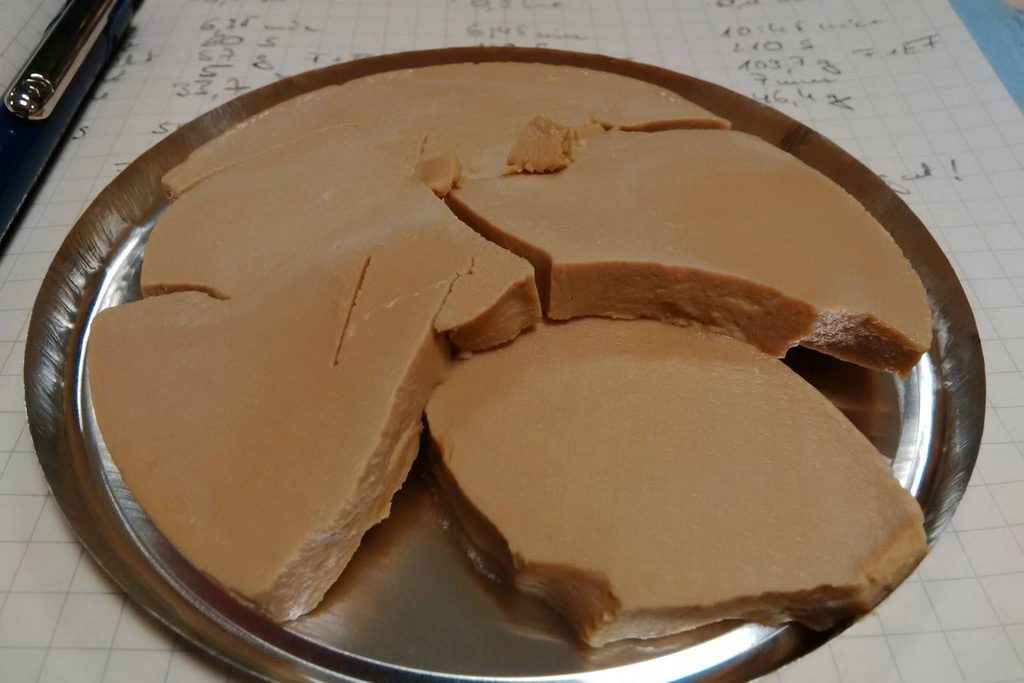
Testing on the actual process slurry produces a written test report covering cake thickness, wash ratios, and drying parameters, along with scale-up recommendations. That report gives the plant a data-backed basis for comparing a continuous system’s labor and yield profile against its current press.
Rotary Pressure Filter (RPF)
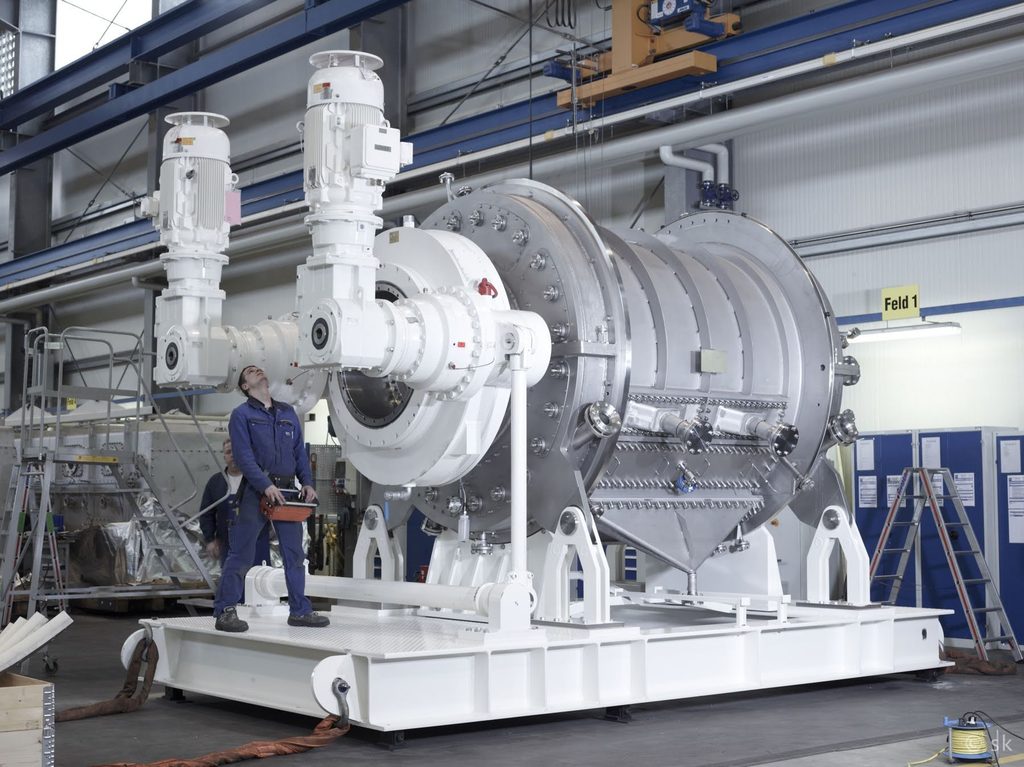
The RPF is a continuous, enclosed thin-cake pressure filter with five to seven independently controlled process zones, operating at pressures up to 90 psig. In the documented case, it addressed all three cost categories. Routine maintenance time dropped to roughly one-tenth of what the batch presses required, availability rose above 96 percent, and the gentler thin-cake process avoided the crystal damage that had been driving yield loss. It did so from a footprint smaller than the redundant presses it replaced.
Continuous-Indexing Vacuum Belt Filter (CI-VBF)
The CI-VBF was evaluated for the same application. It offered slightly better wash performance but left higher residual moisture in the cake. In that plant, residual moisture mattered because of how the cake would feed the existing dryer, and that integration point shaped the final selection. No single performance metric would have pointed to the right answer on its own.
BHS’s recommendation follows the testing. The aim is a validated cost comparison before any capital is committed.
The Real Batch Filtration Bottleneck Is Usually a Cost, Not a Cycle Time
The true cost of batch filtration rarely shows up in a single metric. It is the combined weight of operator hours, batch filtration downtime, redundant equipment, and yield loss, spread across budgets that seldom get compared side by side.
Those costs also tend to grow. Labor and downtime usually scale with throughput, and yield loss becomes more expensive per batch as batch sizes increase or purity requirements tighten.
Evaluate your process before committing to production-scale equipment. Talk with BHS engineers about bench-scale or pilot testing on your slurry, or submit an Application Data Sheet to start quantifying the labor, downtime, and yield exposure in your current batch operation.